
 Bradley Michel
1 min read
Sales dashboards in HubSpot provide a visual and customizable way to track velocity, pipeline, and team performance. Filter, customize, and refine reports to align analytics with sales goals.
📈 Sales Dashboards Overview in HubSpot – Step-by-Step Guide
- Access the Dashboard Section
- Go to the Dashboards area in HubSpot.
- Open the relevant dashboard — in this case: Sales and Deal Velocity and Analytics.
- This dashboard contains a set of standard HubSpot reports focused on sales velocity.
- Explore Available Reports
- Navigate to Reports from the main menu.
- Browse through different analytics suites, particularly:
- Deals Reports
- Forecast & Revenue Reports
- Open a report like Average Deal Size to begin reviewing.
- Understand Report Data
- Click the About tab to understand:
- Where the report pulls data from.
- How it's calculated and structured.
- Adjust the date range:
- Use presets like "This Year" or apply custom or rolling ranges.
- Use Filters to Refine Data
- Apply Quick Filters (e.g., Pipeline) at the top of the report.
- Choose a pipeline such as “Modular Building” to segment data.
- Clear filters as needed using the “Clear All” button.
- Modify Report Visuals
- Switch between views like:
- Totals
- Monthly trends (over time)
- Change chart types (e.g., horizontal bar, column, line).
- Use the Data Table at the bottom to see detailed report data.
- Optionally, edit columns (if supported by the report) to adjust the data view.
- Add Reports to the Dashboard
- Click Save Report.
- Select Add to Existing Dashboard.
- Choose “Sales and Deal Velocity and Analytics” and click Save & Add.
- Customize Additional Reports
- Review and add other valuable reports such as:
- Deal Velocity
- Sales Velocity
- Deals Won and Lost
- Time Spent in Deal Stage
- Push Rate
- Historical Snapshots
- Use filters or customize to adjust for pipelines or specific team segments.
- Advanced Filtering Options
- If a quick filter isn’t available:
- Click Edit Filters.
- Add Advanced Filters (e.g., by Pipeline using AND/OR logic).
- Apply and save your changes as needed.
- Customize Dashboard Layout
- Resize widgets by dragging from the bottom-right corner.
- Reposition reports using drag-and-drop.
- Remove irrelevant reports by clicking the delete icon.
- Apply Dashboard-Wide Filters
- Use Quick Filters at the top of the dashboard to:
- Filter all reports at once (e.g., by a specific pipeline or team).
- Toggle filters on and off for quick comparison.
- Customize Reports from the Dashboard
- Click on a report > Customize:
- Adjust time frames (e.g., switch from monthly to quarterly).
- Modify chart type, properties, and displayed fields.
- Save and update the report for continued use.
- Final Review and Ongoing Iteration
- Perform a final walkthrough of your dashboard.
- Evaluate whether the reports meet your needs.
- Continue refining or consult with your CRM team for advanced custom reporting.
Transcript
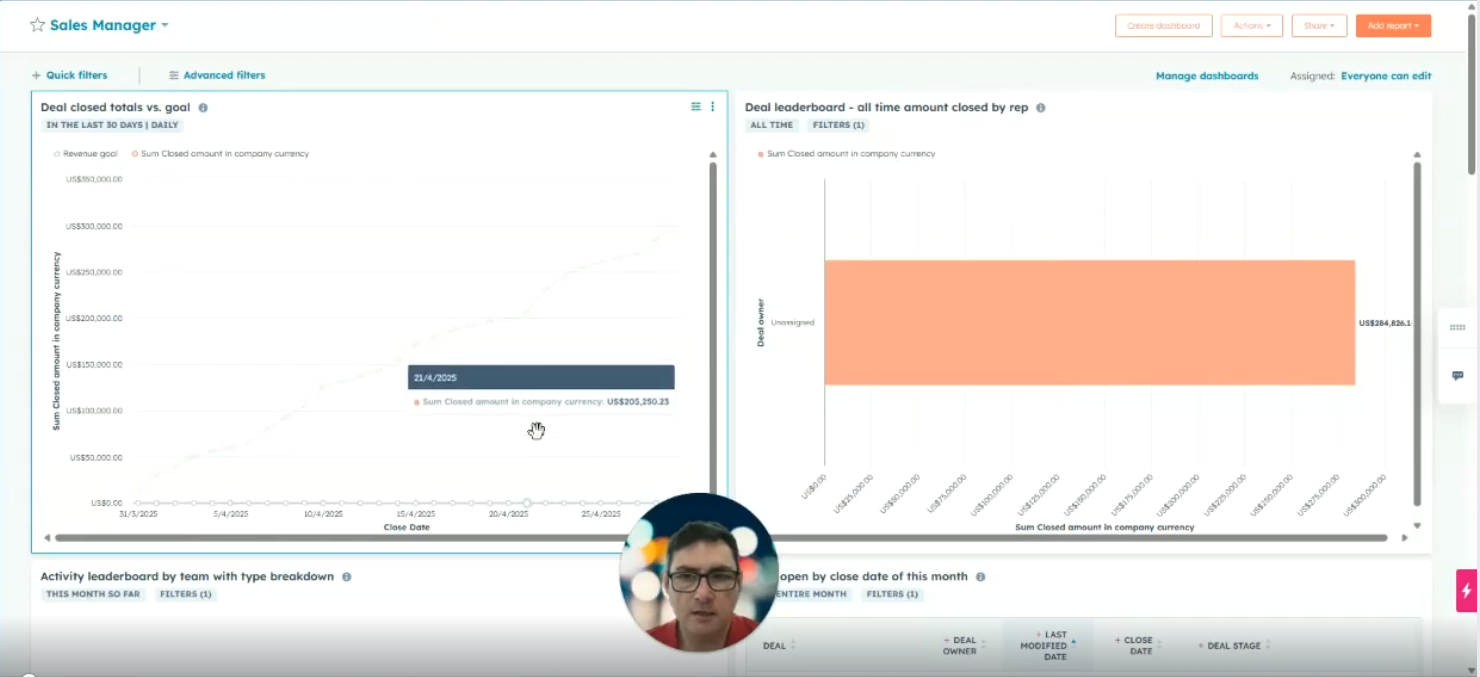
Hi, so, what I want to do today is look at, dashboards and, specifically, we're going to look at sales reporting and a dashboard that we've just put together using standard HubSpot reports. So, this is to help with, sales velocity reporting in particular. So, we'll just go into the dashboard section, and you can select your dashboards up here. The one that I'm going to look at today is, sale and deal velocity and analytics. So, we've put a bunch of reports in here which have come from HubSpot. So, these are all standard reports, and what I'm going to show you is, where to find these reports, and how to make minor adjustments to the reports, and how to add those reports into a dashboard, and how you can do filtering once you're in there. So, the starting point is that we go and have a look at reports.
So, we just click here. And each of the analytic suites, has its own set of reports. And what we're going to be looking at is the deals reports, the forecast and revenue reports. So, we can just go and check each of these to see what's included. So, I'll just start with this first one where we're looking at average deal size. so, there's a few elements here to look at. If you really want to understand what this report is about and where it's putting its data and, how it's getting the results that it's getting, this section up here, the about tab, explains where the data's coming from and how it's put together. At the moment you can see up here that we're basing this on the last month, but we can go in and we can choose a different reporting period, so we'll do it for this year. And actually, before doing that, I can also just show you here that you can put in custom date ranges or a rolling date range. But we'll just do this one for this year. This one already has, a quick filter at the top here, showing pipeline. Now this is going to be really useful for, comparing the performance of different sectors.
So, if we click on that, we can see that all of your different pipelines are available, so we'll just choose one of them, we'll choose modular building. And then you'll get the, the results for that particular pipeline. And just click here to clear all the quick filters and we go back to were. There's a few other things to look at here as well. At the moment we're showing all the totals against individuals. But we can click here, and we can do this over time so you can see that we've now got monthly totals so that may be quite useful approach to look at. we can also have the choices to, currently we've got a horizontal bar, but we can look at any of the following tables. Obviously, you need to pick one that fits the data that's being provided. But you can do that to help you to, look at the data, in a way that makes best sense of it. Worth also looking at the bottom here where we have a table of all the data that's included.
So, this is summarized data. And you can go in here and edit columns if you want a better breakdown. So, we can just go in. And so, there's none available here. Cancel out of that. So, you can go in and if there are available columns, then you can go and add those in. There's also an unsummarised data set, although that's not available for this report. But for some reports you can obviously go in and pull the raw data out. Now, when you've finished with this report, you may want to save it and add it to your dashboard. So, we'll just go up the top here and click Save Report. And you have the option to existing dashboard. And we're going to add that to our Sales and Deal Velocity and Analytics dashboard. And we'll go click Save and Add. That's been added to the dashboard.
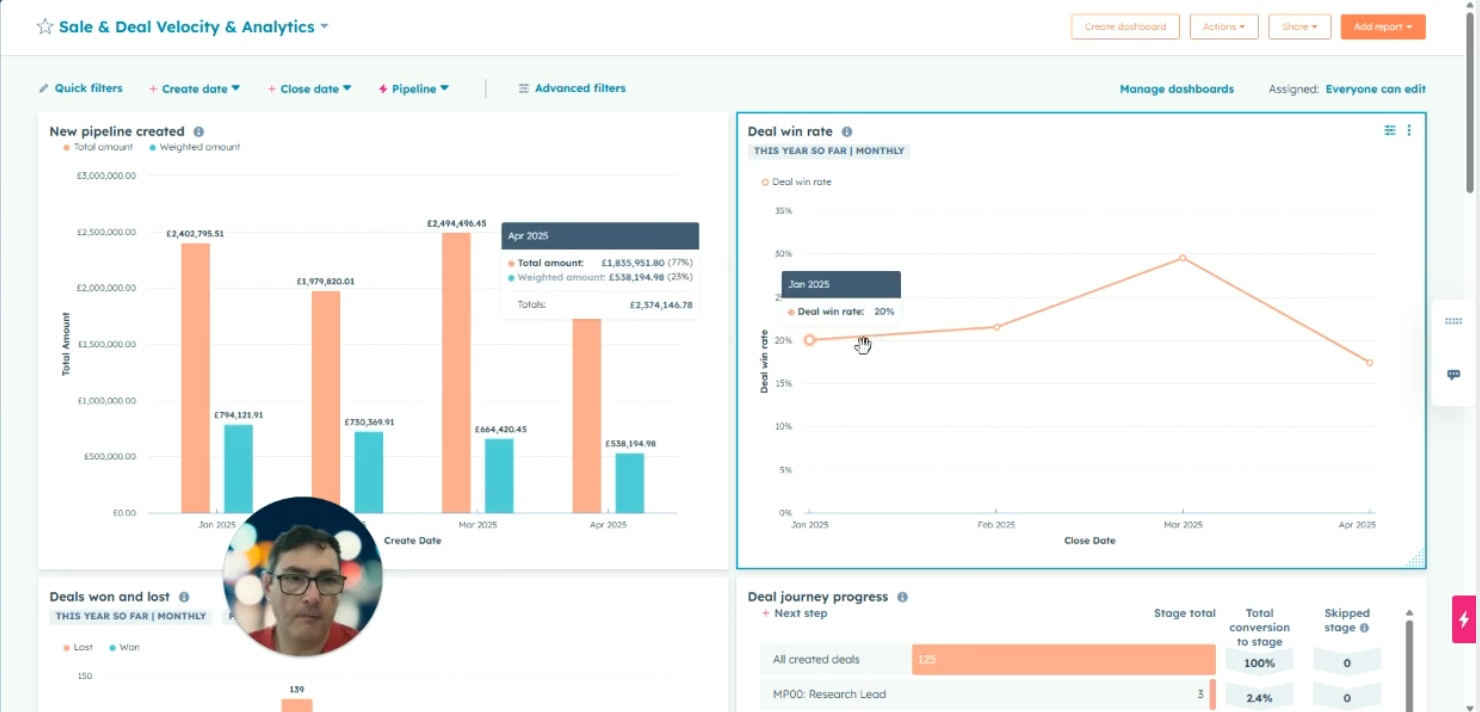
So, looking at some of those that may be of interest to you particularly, really going through these is going to be useful. I've already picked those that I thought would be of most interest and added them to the dashboard already, but we've got Deal Velocity. I'll do that by totals. And actually, in this situation it's worth looking at here. You can see, there’s a couple of other options if you want to try and break this down by pipeline again. This one doesn't have it automatically added. So, what] we'll go is, we’ll check more, and you can see the pipelines listed there and we can choose a particular pipeline and that will show us, performance against that pipeline. Sometimes it isn't shown under the quick filters either. I'll just, reset that filter and if that's the case then you may sometimes need to add an advanced filter and by doing that, go into edit filters and we'll add a filter, and we'll type in pipeline, and we can select your pipelines, our pipeline here, and you can see that it's changed down the bottom there and then we'll just close the editor. For this I'll, delete that and we'll leave it as it is.
So, deal velocity is useful, you can have a look at deals won and lost, similar approaches to being able to filter those, we've also got sales velocity, time spent in deal stage, is quite a complex report but it might be of use to you. The other one that we found that we thought would be really useful, and this is in the dashboard, is historical snapshots. And this is showing how the deals have changed month by month. Another one that's in here is push rate. So, this identifies proportion of deals, and again, you can do it by sector, which have had the close date pushed out. Again, you can go and look in this about the report and it goes into, into more detail and, so that provides, really useful information, and particularly around, sector specific information. So best thing really for the next steps is if you go and have a look at each of these and see whether you can make use of them and if you can then add them to your dashboard and if you need h help with looking at the filters, then, just contact us and we can go through those and try and set those up for you, or if they give you some ideas about types of reports that you're looking for, then, we can go down the route of custom reporting and creating reports that provide you with the specific information that you're looking to show.
So, I'm just going to take one last look before we finish up at the dashboard that we created. And show you a quick couple of things around the dashboard. These quick filters can be used to filter all of the entire dashboard, so you could go in here and, check a specific dashboard and then apply, there we go. And so, this will make changes across the, across the dashboard, and we'll turn that off by clicking that there. So, we've got some interesting reports here, new pipeline created, win rate, we're looking at comparison of deals won and lost, we're looking at the deal journey and the stages, and deal velocity we've got there, push rate we've spoken about, sales velocity, here's the historical snapshot, looking at deals won and lost per person, we've got the historical snapshot there again, so, we'll take that Click there and delete and we can resize these and move them around.
So, just click on it and drag it to where you want it to be, if you think it's too small, too big rather, you can change the size of it, just by clicking the bottom right-hand corner, if you're still not sure that it's showing you the data that you really want to see, then you can go and click here to go and make changes and customize the report. So, click customize. You can make changes to these metrics and just save it, so, if we decide to do it quarterly, for example, it will enable you then to go and update the existing report, just go back to monthly, or you can go and customize in more detail, and it will open up the original report, and you can, you play around here with, the specific fields or properties that are being used.
And that's about it really so I hope you find that useful and if you've got any questions then get in touch and we'll do what we can to help. Thank you very much.
Enjoyed this blog?
Here's some others we think you'll love
1 min read
How To Use HubSpot: A Practical Guide to Transforming Your Business
HubSpot is more than just a CRM. It’s a strategic growth platform that, when used correctly, can transform how you generate leads, manage deals,...

1 min read
Top 10 HubSpot Updates for Manufacturing, Distribution, and Wholesale from INBOUND 2025
INBOUND 2025 has once again set the pace for the future of business, laying out a bold new blueprint for building "hybrid human-AI teams." For...