
 Bradley Michel
1 min read
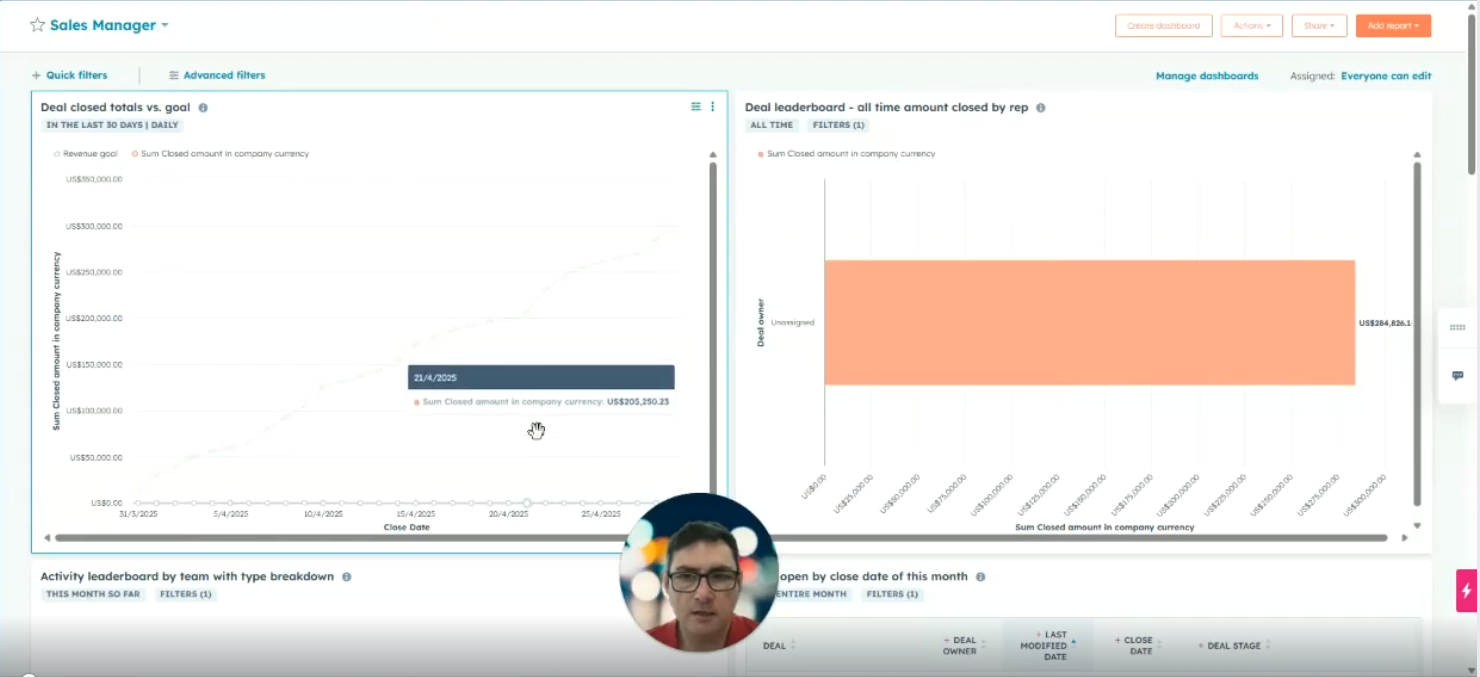
Sales Dashboard Overview
Sales dashboards in HubSpot provide a visual and customizable way to track velocity, pipeline, and team performance. Filter, customize, and refine...
1 min read
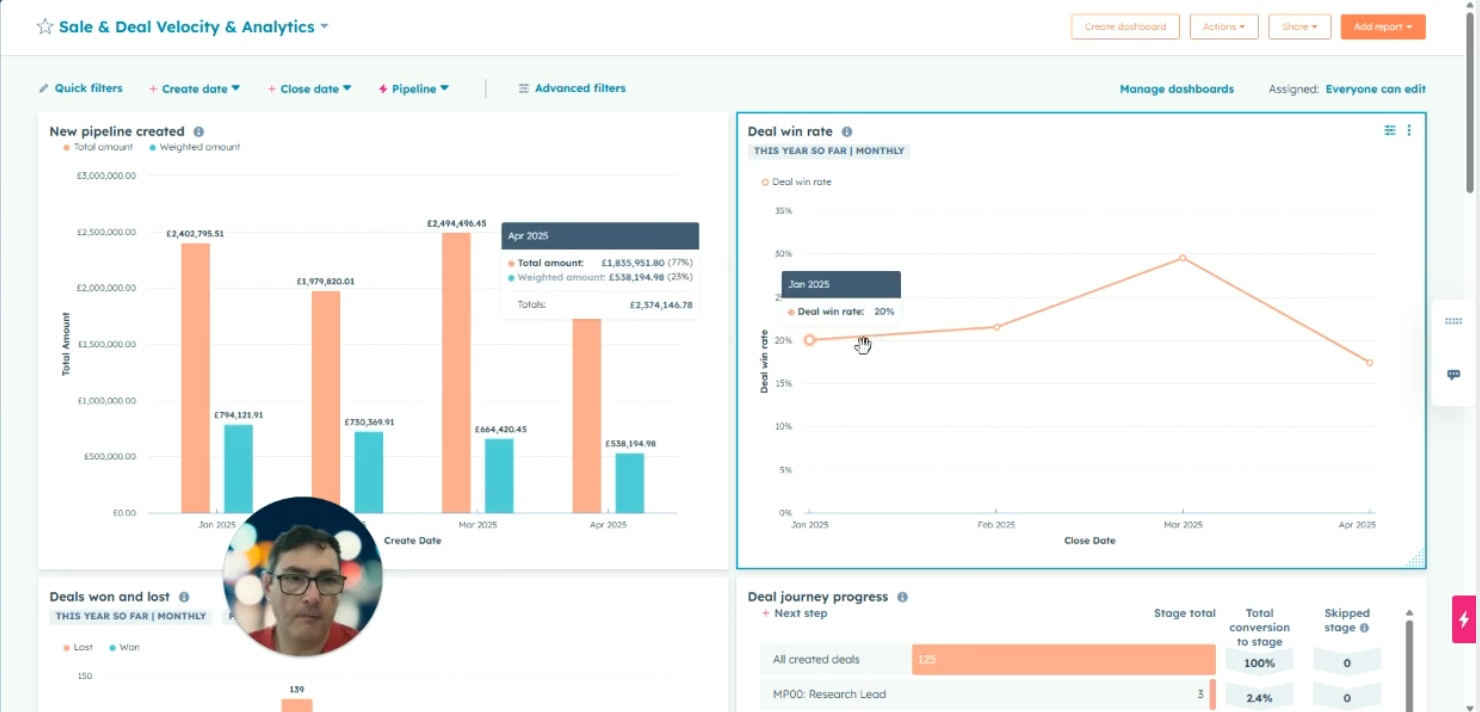
Sales dashboards in HubSpot provide a visual and customizable way to track velocity, pipeline, and team performance. Filter, customize, and refine...
1 min read
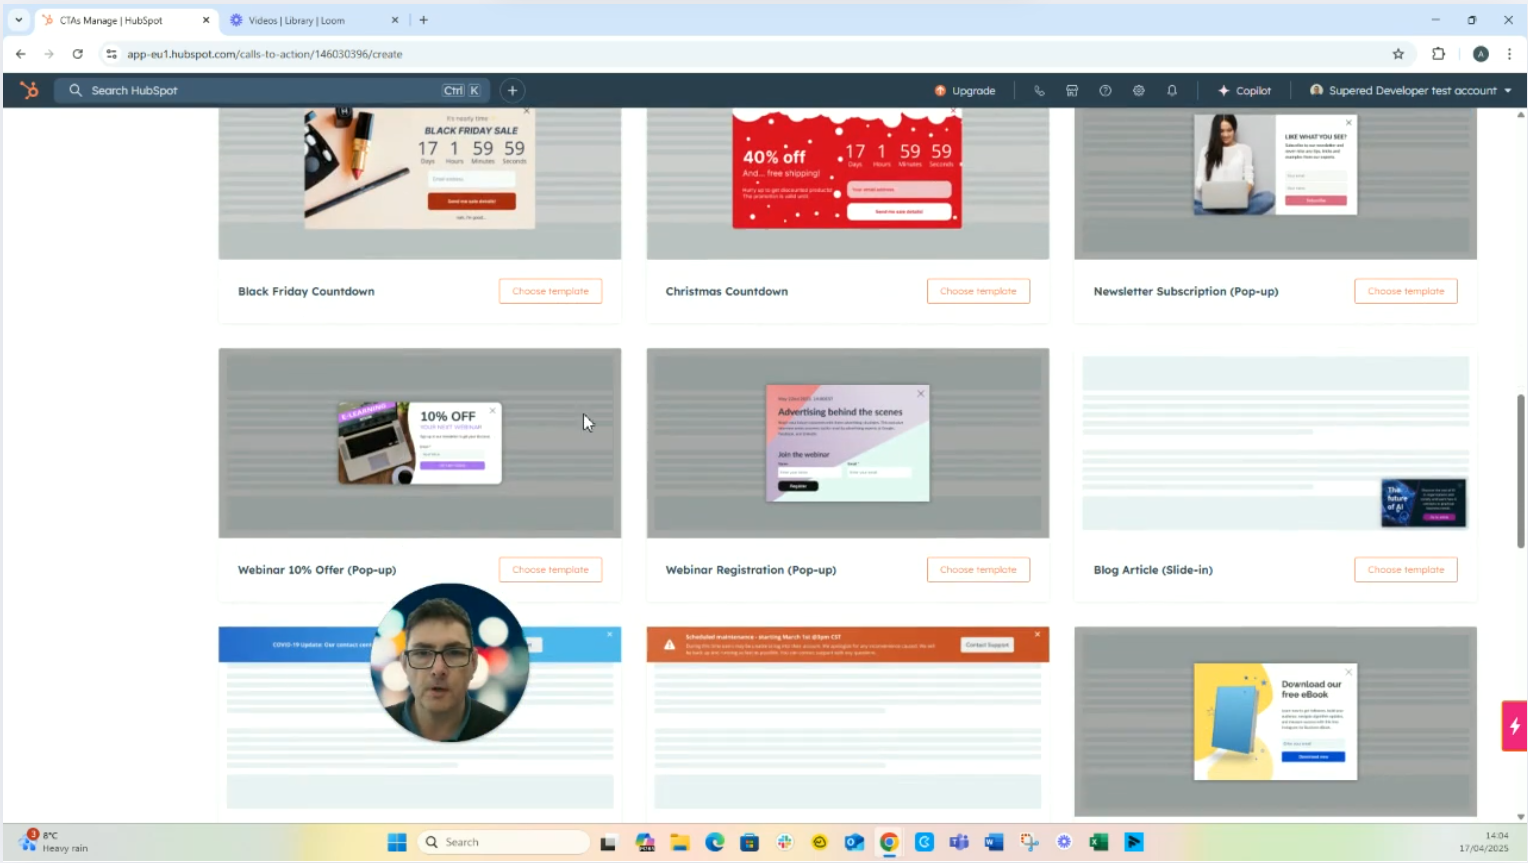
Updating HubSpot forms and CTAs ensures seamless lead capture. Create or link forms directly in CTA modules, customize fields, and publish updates to...
1 min read
Implementing HubSpot is an exciting step toward transforming how you market, sell, and serve your customers. But success doesn’t happen just because...